
Build / Dashboards
Build
Dashboards
Build dashboards with charts, tables and numbers that help you decide.
A good dashboard answers a question at a glance: how are we doing, and what should I do next? Firelent builds dashboards with charts, tables and key numbers — for your own tracking, a small team or a project you want to keep an eye on.
What you can build#
- Personal trackers — budget, habits, workouts, reading, savings goals.
- Small team boards — open tasks, shift plans, equipment and stock.
- Simple sales and client lists — who's in the pipeline, what's next.
- Project and goal overviews — progress towards targets, week by week.
Looking for your website's visitor numbers? Those are already built in: see Statistics.
What's inside a Firelent dashboard#
| Building block | Use it for |
|---|---|
| Key numbers | The three to five figures that matter most, each with a comparison |
| Line and area charts | How something changes over time |
| Bar charts | Comparing categories or ranking things |
| Pie and donut charts | Shares of a whole — with only a few slices |
| Tables | The details behind the numbers, sortable |
| Sidebar and tabs | Moving between views |
| Date ranges and filters | Narrowing what you see |
Your dashboard's data is either entered in the dashboard itself — and saved with Firelent Cloud — or written in by you as fixed numbers.
Plan it first#
Most dashboards fail because they show everything. Before your first prompt, decide:
Who looks at it, and when
“Me, every Monday morning” leads to a very different dashboard than “the team, all day”.
The decision it supports
What will you do differently after looking at it? That decides what goes at the top.
Three to five key numbers
Name each one and say exactly how it's calculated — for example, “revenue = all paid orders, without refunds”.
The right chart for each question
Trends over time → a line chart. Comparing → a bar chart. Shares of a whole → a pie chart with no more than five slices.
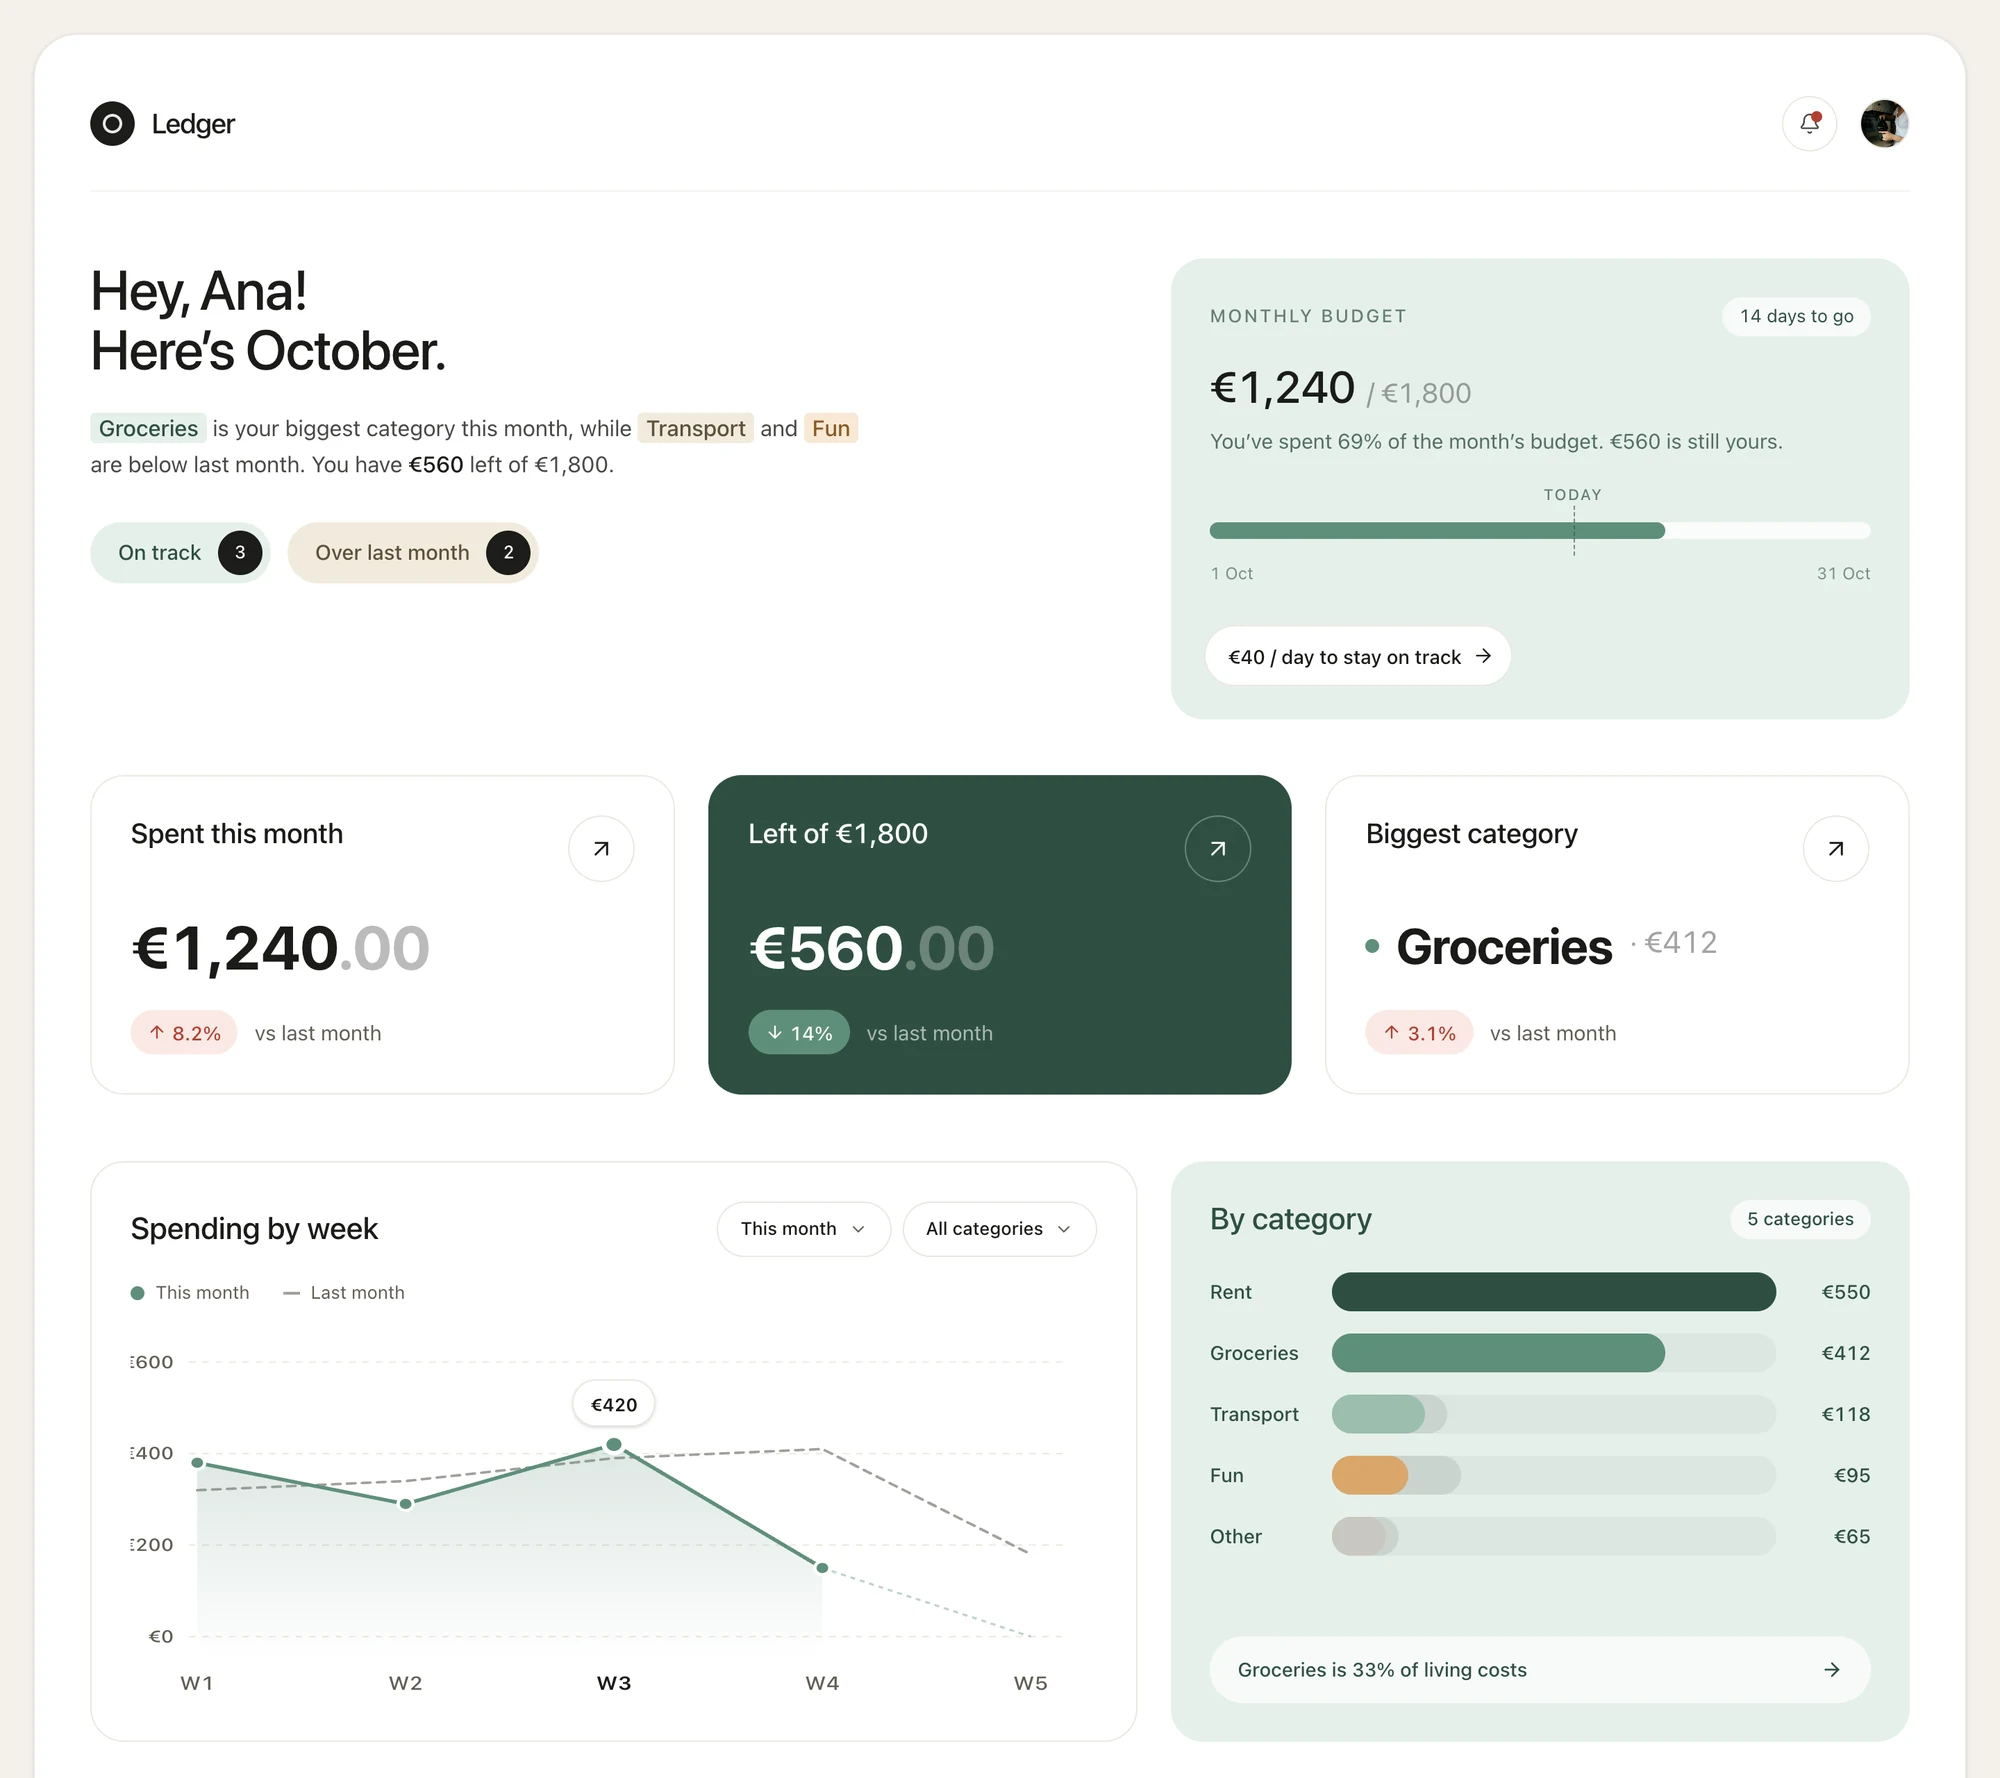
Build a household budget dashboard. I enter expenses with an amount, a category (rent, groceries, transport, fun, other) and a date. Top row: spent this month, left of the €1,800 budget, and the biggest category — each compared with last month. Below: spending by week as a line chart, by category as a bar chart, and a table of this month's expenses, newest first. A form to add an expense. Calm, light design.
Make it better#
- Check three numbers by hand. Pick a few figures and work them out yourself. If they don't match, tell Firelent exactly how the number should be calculated.
- Design the empty state. What does the dashboard show before any data is in? A friendly “Add your first expense” beats an empty chart.
- Show which range you're looking at — “this month”, “last 30 days” — right next to the numbers.
- Start bar charts at zero. A bar chart that starts higher makes small differences look huge.
- Add filters last, once the main view is right.
- Remove what nobody looks at. A dashboard gets better with every chart you take away.
Good to know#
- Lists show up to 100 entries at a time. Dashboards work best with a few hundred entries or less.
- The dashboard loads its data when it opens. Reload to see entries others just added.
- Data your dashboard stores can be read by anyone using it. Use dashboards for numbers that aren't confidential — no customer details or private finances you wouldn't share.
- Outside data sources — Google Sheets, Stripe, your accounting tool — can't be connected yet.
FAQ#
Can I connect Google Sheets or another tool?#
Not yet. Dashboard data is entered in the dashboard and saved with Firelent Cloud.
Can I lock my dashboard to just me?#
Not yet. There are no admin-only areas, so don't put confidential figures in a dashboard.