
Create / Spreadsheets
Create
Spreadsheets
Excel files with working formulas, several sheets and clean structure.
Budgets, trackers, price lists, schedules, simple financial models — describe what you need to keep track of, and Firelent builds it as an Excel file with working formulas, several sheets and a clean structure. Open it in Excel, Google Sheets or Numbers and fill it in.
How it works#
Open Spreadsheet
On your dashboard, click Create and choose Spreadsheet — or ask for one in the chat of any website project.
Describe it
Say what you track, which sheets you need and what should be calculated.
Check the structure
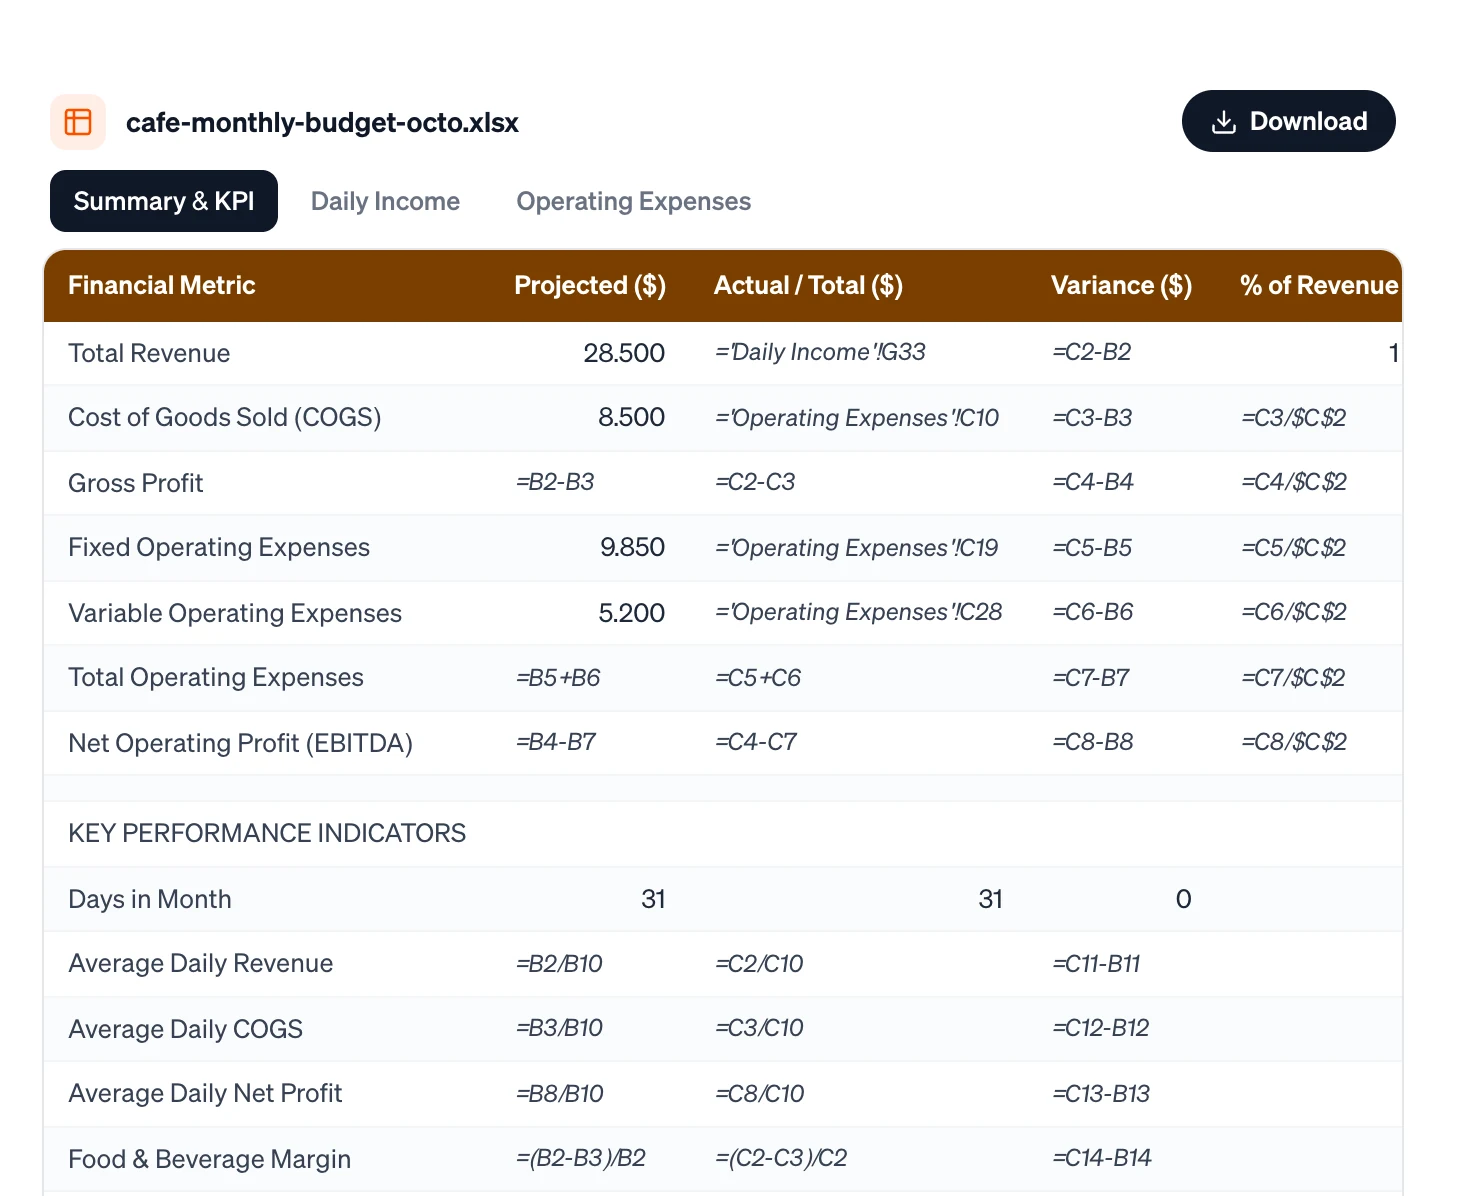
The preview next to the chat shows each sheet as a tab, with its columns and formulas.
Download and open it
Click the file in the chat or Download above the preview, and open it in your spreadsheet app — that's where the formulas calculate.
Each spreadsheet costs 2 credits — refunded automatically if something goes wrong.
What's in your spreadsheet#
| File | Excel (.xlsx) — opens in Excel, Google Sheets and Numbers |
| Sheets | Several sheets in one file, for example data, costs and a summary |
| Formulas | Real Excel formulas — sums, averages, differences, percentages, references between sheets |
| Formatting | A coloured header row that stays in place as you scroll, sensible column widths and number formats |
Charts, conditional formatting, dropdown lists and macros aren't added yet. Once your numbers are in, add a chart in your spreadsheet app — in Excel, select the data and choose Insert → Recommended Charts.
The preview shows formulas, your app shows results
In the preview, a cell like =B2-B3 shows the formula itself. Open the file in Excel, Google Sheets or Numbers to see the calculated values. Quick previews — in an email or a file browser — may show empty cells for the same reason.
Write a prompt that makes a good spreadsheet#
- What do you track? List the columns: “date, product, quantity, price”.
- Which sheets? For example one for raw data, one for costs and one for the summary.
- What should be calculated? Totals, averages, differences, margins — name each one and how it's worked out.
- Example data or empty? Ask for realistic example rows to see how it works, or for empty rows to fill in yourself.
Create a monthly budget spreadsheet for a small café: one sheet for daily income, one for fixed and variable costs, and a summary sheet with total income, total costs, profit and margin as formulas. Fill it with realistic example numbers for October.
Build it to last#
These habits keep a spreadsheet easy to use and hard to break — ask for them in your prompt:
- Inputs, calculations, results — in that order. Typed numbers in one place, formulas in another, the summary on its own sheet.
- One table per sheet, starting in the top-left corner, with one header row.
- One thing per cell. “12 kg” belongs in two columns: 12 and kg.
- Dates as dates, written the same way everywhere — ideally 2026-10-31.
- No merged cells and no blank rows in the middle of your data — they break sorting and filters.
- No totals inside the data. Put them in the summary.
Check the numbers#
Spreadsheets look trustworthy even when they're wrong. Before you rely on one:
- Check two or three results by hand — a total, a percentage, a difference.
- Click a few formula cells to see what they add up. A formula pointing at the wrong row is the most common mistake.
- Replace the example numbers with your real ones before you share it.
Change it#
Ask in the same chat — “add a sheet for staff costs”, “show the margin as a percentage”. Firelent creates a new version as a new file, for 2 credits, written from your request and a summary of the previous version. If you've already entered real data, make small changes in your spreadsheet app instead, so you don't lose your entries.
FAQ#
Can I upload my data or an existing spreadsheet?#
Not yet. You can paste a few rows into your message as text, and Firelent will use them.
Does it work in Google Sheets?#
Yes. Upload the file to Google Drive and open it with Google Sheets — the formulas calculate there.
Can it make charts?#
Not inside the spreadsheet yet. Add them in your spreadsheet app, or see Visualizations for other ways to show your numbers.